
Getting Started
Upcoming cash
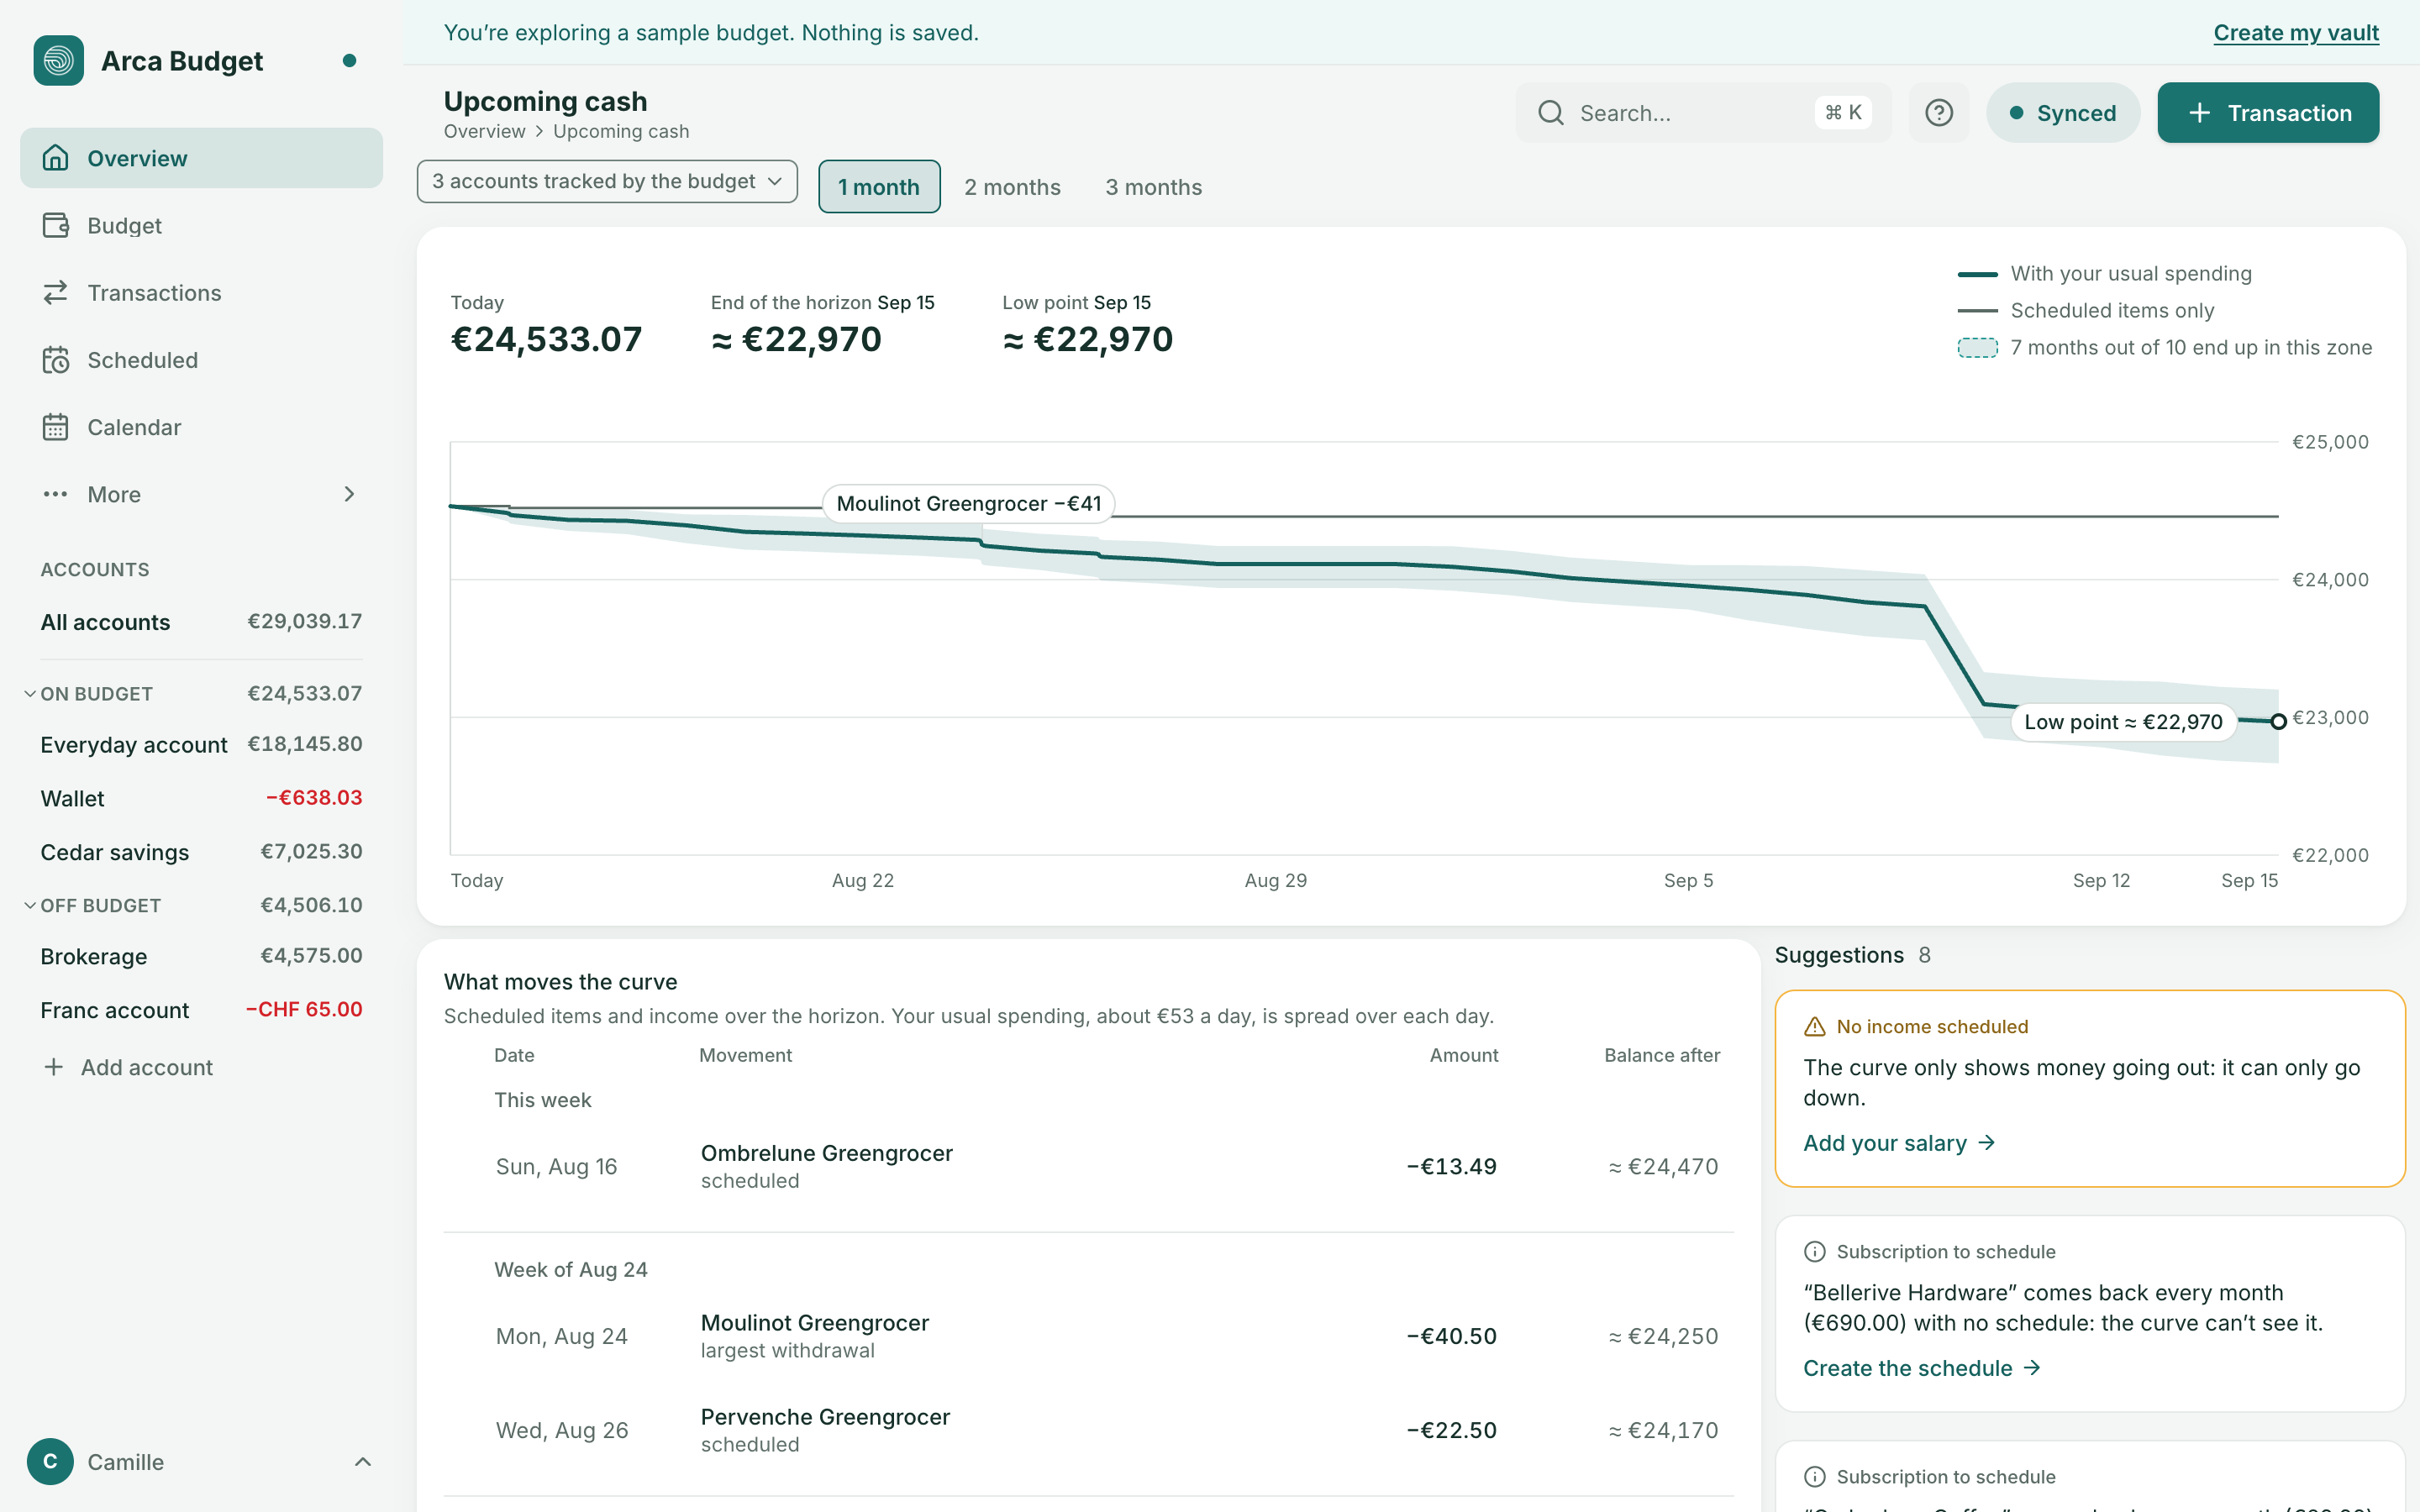
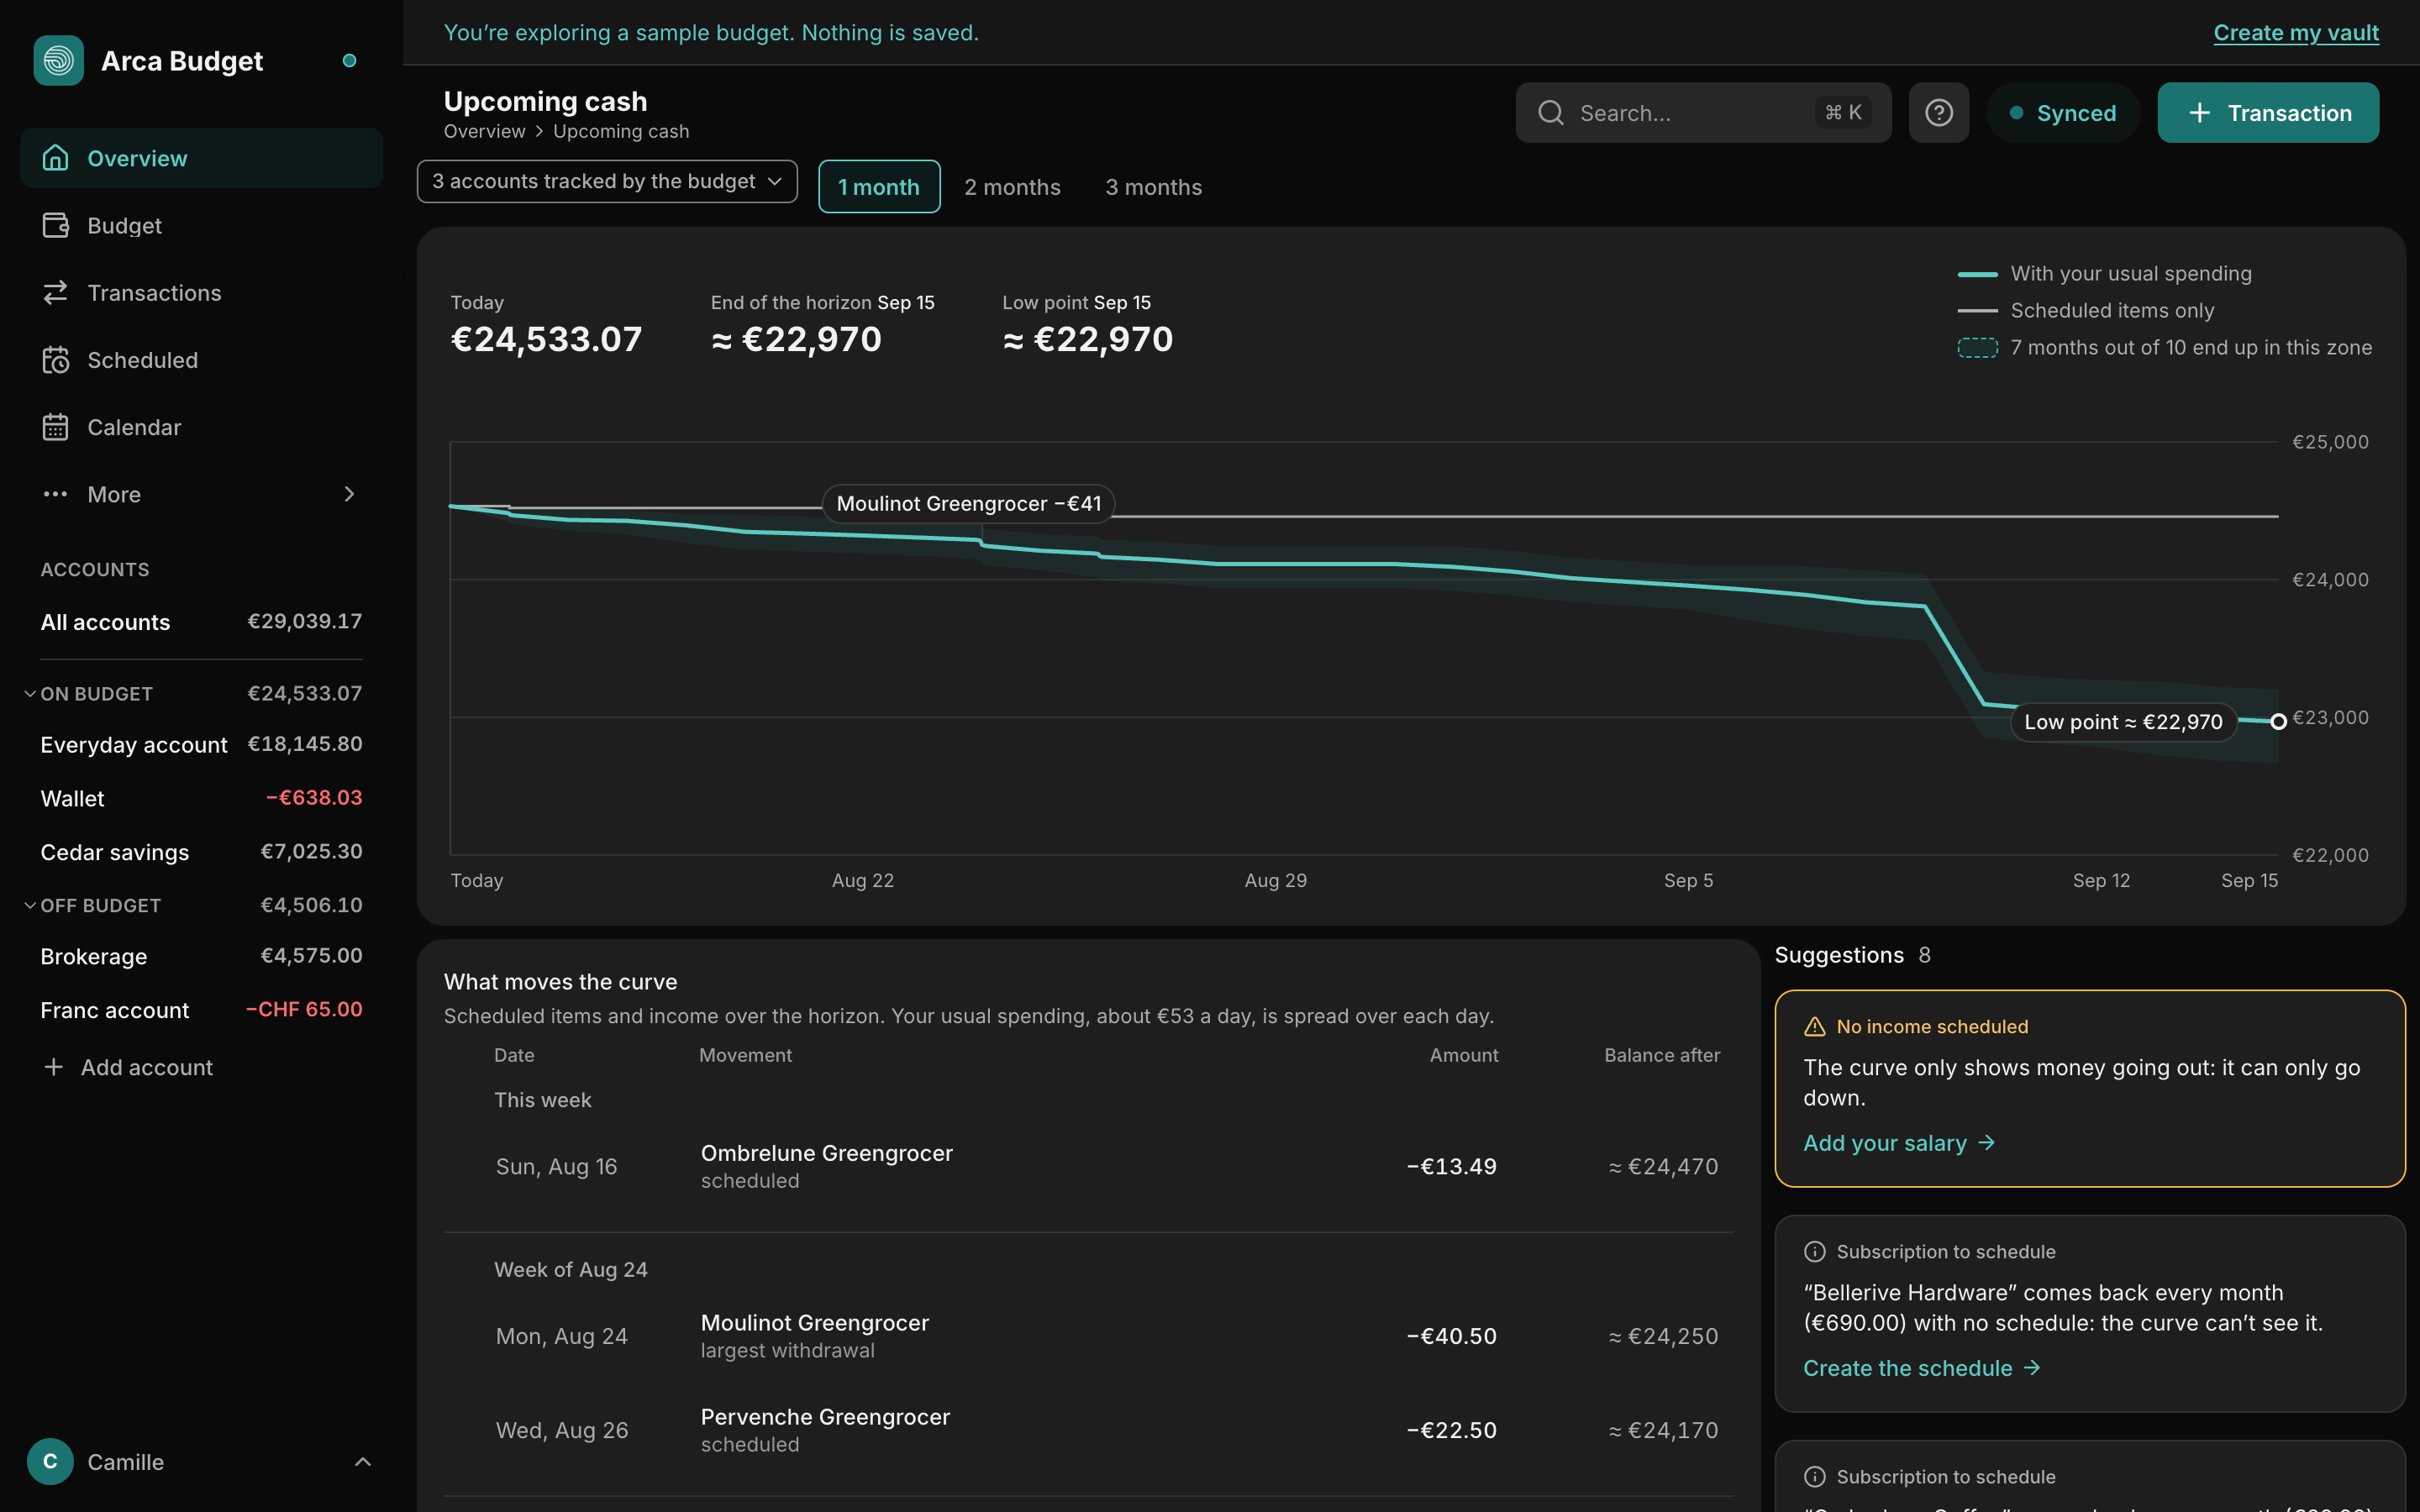
Upcoming cash extends the balance of your accounts day after day, from today to one, two or three months ahead: what will be left, and the day it will be at its lowest. It is Arca’s “cash calendar” — a projected balance for each day. Don’t confuse it with the Calendar page, which places your scheduled items on a grid without saying what will be left in the account.
Overview shows a summary of it; this page is the detail.
Opening it
Section titled “Opening it”- From Overview: See details, on the Upcoming cash card. On a narrow screen, touching the card is enough.
- From the sidebar: Upcoming cash, right under Reports (on a phone, under More). It stays highlighted while you are on this page.
- From search (⌘K, or Ctrl+K): type “Upcoming cash”.
The three figures
Section titled “The three figures”- Today: the balance of the accounts the curve looks at.
- End of the horizon, with its date: the expected balance at the end of the chosen period.
- Low point, with its date (or “today”): the lowest balance of the period. It turns red if it is below zero. On a phone, it comes first and large.
When the curve takes your usual spending into account, the two expected figures are preceded by ≈ and rounded to 10: they are estimates. When only your scheduled items count, they are exact, to the cent.
The two lines and the zone
Section titled “The two lines and the zone”The curve starts from today’s balance and carries two lines:
- Scheduled items only (thin line): today’s balance plus only your dated movements — the occurrences of your schedules, including those due today or missed, which the curve counts from today, and the transactions you entered with a future date. It stays flat, then jumps on the date of a movement.
- With your usual spending (thick line): the same, minus what you usually spend, spread over each day. It slopes gently down between two movements and takes a step on the exact date of each one.
Around the thick line, a zone: it is drawn from your own past months, replayed one by one. Its legend says “7 months out of 10 end up in this zone”: that is an indication drawn from your history, not a guarantee. The zone never narrows from one day to the next: uncertainty doesn’t shrink with time. When the curve or its zone goes below zero, the part under the zero line is tinted pale red.
On a computer, the legend sits to the right of the figures; on a phone, it is folded under the curve (Legend).
Usual spending
Section titled “Usual spending”It’s the monthly average of your spending over your last 12 full calendar months (three at least). The current month and the very first month of entries, both incomplete, are left out; with less than 12 months of history, the average is made over the ones that exist. It is calculated with the same rule as “Spent this month”: a refund reduces spending, a transfer between two accounts the curve looks at isn’t spending; to another account, it is.
So that nothing is counted twice, the spending of the payees that your active expense schedules already cover is excluded: it enters the curve through those schedules.
The average follows the rhythm of your month: if you spend more early in the month, the line falls faster early on. With less than three full months, there is no thick line and no zone: the curve only draws “Scheduled items only”, a “Not much data” suggestion says so, and the line will appear over time. “Month pace”, on Overview, reads the same average.
The markers
Section titled “The markers”On the curve, four markers at most: the low point, the crossing below zero (“Below zero on …”), the biggest income and the biggest withdrawal of the period, with their name and amount. A circle marks the low point. On a phone only this circle stays, without text: the list names the rest.
Reading a day
Section titled “Reading a day”Hover the curve, or touch it: a bubble gives the date, the balance of both lines, the range of the zone, the day’s movements and, when the thick line takes one off, the day’s usual spending. On touch, a second tap on the same day closes the bubble.
With the keyboard, focus the curve: a screen reader announces “Today …, on …, about …, low point …”. The left and right arrows change day, Home and End go to the two ends, Esc closes.
What moves the curve
Section titled “What moves the curve”Under the curve, the list of the period’s movements, week by week (from Monday): “This week”, then “Week of …”. Each row gives the date, the movement (the schedule’s name, or “Entered transaction” for a transaction without a name), its amount and the balance after. Income is preceded by a “+”; the biggest withdrawal is flagged. Two more rows come with them: the low point and the end of the horizon (unless it is already the low point), each on its own row.
- The balance after is the one on the drawn line, at the end of the day. When several movements fall on the same day, only the last row of the day carries it.
- When the thick line exists, the sentence above the list reminds you what your usual spending weighs (“Your usual spending, about €53 a day, is spread over each day.”): without it, a balance that drops between two rows would be surprising.
Choosing a row — hovering it, touching it, or using the up and down arrows (Home, End, Esc) — makes the circle on the curve slide to that row’s day, with its date and balance. When you leave the list, the circle goes back to the low point. If your system asks to reduce animations, the circle jumps without sliding. On a phone, the list replaces the labels on the curve.
Choosing the accounts and the horizon
Section titled “Choosing the accounts and the horizon”- 1, 2 or 3 months: the selector is above the curve; one month is open by default. The horizon is counted in calendar months: August 15 plus one month is September 15.
- Accounts: by default, the accounts tracked by the budget (“3 accounts tracked by the budget”). The menu lets you pick a single one. Only accounts that are open, tracked by the budget and in the budget’s currency are offered: Arca doesn’t convert the amounts of an account in another currency, it would throw the curve off.
These two settings aren’t kept: when you come back to the page, you find one month and the budget’s accounts. The Overview card has no settings: one month, the budget’s accounts.
A transfer between two accounts the curve looks at is neither income nor a withdrawal: it cancels out. To an account it doesn’t look at — outside the budget, or other than the one you chose — it is money going out.
The suggestions
Section titled “The suggestions”Next to the list on a computer (below it on a narrower screen, in a single card on a phone), cards tell you what may throw the curve off, or make it more accurate — one action per card. Three are visible; “See N more suggestions” expands the next ones, and “Show fewer suggestions” folds them back. On a phone, a red suggestion (“Could go below zero” when the thick line goes below zero) comes before the list. They are ordered by seriousness:
- Could go below zero — red when the line goes below zero (“Your balance could go below zero on …”, or “… is already below zero today”); amber when only the zone does (“The line stays above €0, but around … 1 month in 10 would end up below zero”). Action: Open the schedule.
- Data out of date — an account with no entry for more than 14 days is named: the starting point may be too high. Action: Import a statement, with that account already chosen as the destination.
- Missed occurrence — a scheduled item whose date has passed and that no transaction settles; the curve counts it from today. One card per schedule, for its oldest occurrence. Action: Mark as paid, which records the transaction; a notification offers Undo.
- No income scheduled — the curve only shows money going out: it can only go down. Action: Add your salary, which opens a new schedule already set to income and named “Salary”; you choose the account and the amount.
- Subscription to schedule — a regular payment spotted in your transactions, with no schedule: the curve can’t see it. Action: Create the schedule, already filled in (payee, average amount, account of the latest transaction, next date). A payment you dismissed with Ignore on the Scheduled page is no longer offered.
- Unusual expense — an expense from the last 30 days, well above the average of its envelope (“… times your average”). Action: See the transaction.
- Not much data — less than three months of history: the usual-spending line is absent. Action: Import an older statement.
These cards only appear when a curve is drawn. The two that rely on the detection of regular payments — the subscription and the unusual expense — come from a calculation made on our servers: offline they are missing, and all the others stay on screen.
When there is nothing to draw
Section titled “When there is nothing to draw”With no movement at all over the period — no scheduled item, no transaction dated in the future — the curve isn’t drawn: the page shows today’s balance and offers to Add a schedule.
What the curve can’t know
Section titled “What the curve can’t know”Arca isn’t connected to any bank: the curve only knows what you entered or imported. At the bottom of the page, How the curve is calculated recalls the method (folded on a phone) and says when you last wrote to your accounts: “Last entry 3 days ago”. An account with no entry for more than 14 days is flagged as out of date, and named.
For the reasoning behind this page and what other apps do, see the guide The cash calendar.
Was this page helpful?
Thanks — noted.